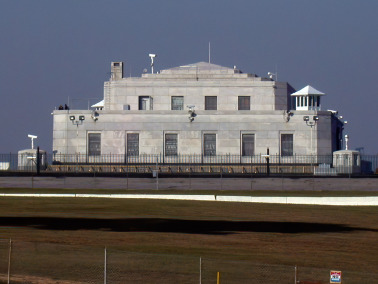
The TSP Card Storage of Southern Fort Knox
Haere mai ki te tonga
Region: Southern Fort Knox
Quicksearch Query: Southern Fort Knox
|
Quicksearch: | |
NS Economy Mobile Home |
Regions Search |
Southern Fort Knox NS Page |
|
| GDP Leaders | Export Leaders | Interesting Places BIG Populations | Most Worked | | Militaristic States | Police States | |

Haere mai ki te tonga
Region: Southern Fort Knox
Quicksearch Query: Southern Fort Knox
| Southern Fort Knox Domestic Statistics | |||
|---|---|---|---|
| Government Category: | TSP Card Storage | ||
| Government Priority: | Administration | ||
| Economic Rating: | Powerhouse | ||
| Civil Rights Rating: | Some | ||
| Political Freedoms: | Average | ||
| Income Tax Rate: | 56% | ||
| Consumer Confidence Rate: | 100% | ||
| Worker Enthusiasm Rate: | 102% | ||
| Major Industry: | Information Technology | ||
| National Animal: | Llamas | ||
| Southern Fort Knox Demographics | |||
| Total Population: | 7,425,000,000 | ||
| Criminals: | 581,663,247 | ||
| Elderly, Disabled, & Retirees: | 907,067,695 | ||
| Military & Reserves: ? | 363,826,250 | ||
| Students and Youth: | 1,375,110,000 | ||
| Unemployed but Able: | 994,235,037 | ||
| Working Class: | 3,203,097,771 | ||
| Southern Fort Knox Government Budget Details | |||
| Government Budget: | $124,867,960,153,885.89 | ||
| Government Expenditures: | $119,873,241,747,730.45 | ||
| Goverment Waste: | $4,994,718,406,155.44 | ||
| Goverment Efficiency: | 96% | ||
| Southern Fort Knox Government Spending Breakdown: | |||
| Administration: | $23,974,648,349,546.09 | 20% | |
| Social Welfare: | $0.00 | 0% | |
| Healthcare: | $10,788,591,757,295.74 | 9% | |
| Education: | $10,788,591,757,295.74 | 9% | |
| Religion & Spirituality: | $7,192,394,504,863.83 | 6% | |
| Defense: | $20,378,451,097,114.18 | 17% | |
| Law & Order: | $16,782,253,844,682.27 | 14% | |
| Commerce: | $11,987,324,174,773.05 | 10% | |
| Public Transport: | $3,596,197,252,431.91 | 3% | |
| The Environment: | $8,391,126,922,341.13 | 7% | |
| Social Equality: | $5,993,662,087,386.52 | 5% | |
| Southern Fort KnoxWhite Market Economic Statistics ? | |||
| Gross Domestic Product: | $96,162,400,000,000.00 | ||
| GDP Per Capita: | $12,951.16 | ||
| Average Salary Per Employee: | $19,904.38 | ||
| Unemployment Rate: | 14.22% | ||
| Consumption: | $83,488,181,479,014.41 | ||
| Exports: | $22,962,107,056,128.00 | ||
| Imports: | $25,421,380,845,568.00 | ||
| Trade Net: | -2,459,273,789,440.00 | ||
| Southern Fort Knox Non Market Statistics ? Evasion, Black Market, Barter & Crime | |||
| Black & Grey Markets Combined: | $325,907,191,449,346.94 | ||
| Avg Annual Criminal's Income / Savings: ? | $47,163.48 | ||
| Recovered Product + Fines & Fees: | $34,220,255,102,181.43 | ||
| Black Market & Non Monetary Trade: | |||
| Guns & Weapons: | $15,379,193,718,904.30 | ||
| Drugs and Pharmaceuticals: | $13,716,578,181,725.46 | ||
| Extortion & Blackmail: | $24,939,233,057,682.64 | ||
| Counterfeit Goods: | $27,017,502,479,156.20 | ||
| Trafficking & Intl Sales: | $7,897,423,801,599.51 | ||
| Theft & Disappearance: | $11,638,308,760,251.90 | ||
| Counterfeit Currency & Instruments : | $35,330,580,165,050.41 | ||
| Illegal Mining, Logging, and Hunting : | $7,066,116,033,010.08 | ||
| Basic Necessitites : | $5,819,154,380,125.95 | ||
| School Loan Fraud : | $10,391,347,107,367.77 | ||
| Tax Evasion + Barter Trade : | $140,140,092,323,219.19 | ||
| Southern Fort Knox Total Market Statistics ? | |||
| National Currency: | SPIT | ||
| Exchange Rates: | 1 SPIT = $0.90 | ||
| $1 = 1.12 SPITs | |||
| Regional Exchange Rates | |||
| Gross Domestic Product: | $96,162,400,000,000.00 - 23% | ||
| Black & Grey Markets Combined: | $325,907,191,449,346.94 - 77% | ||
| Real Total Economy: | $422,069,591,449,346.94 | ||
| Southern Fort Knox Economic Statistics & Links | |||
| Gross Regional Product: | $675,186,374,344,704 | ||
| Region Wide Imports: | $81,707,717,885,952 | ||
| Largest Regional GDP: | Thorn14 | ||
| Largest Regional Importer: | Southern Fort Knox | ||
| Regional Search Functions: | All Southern Fort Knox Nations. | ||
| Regional Nations by GDP | Regional Trading Leaders | |||
| Regional Exchange Rates | WA Members | |||
| Returns to standard Version: | FAQ | About | About | 484,616,277 uses since September 1, 2011. | |
Version 3.69 HTML4. V 0.7 is HTML1. |
Like our Calculator? Tell your friends for us... |